- Year to date return of Alphabet Inc. is 57.71%, while the 3 months return is 8.59%.
- NASDAQ: GOOG stock price is going to break its all time high level at $152.10.
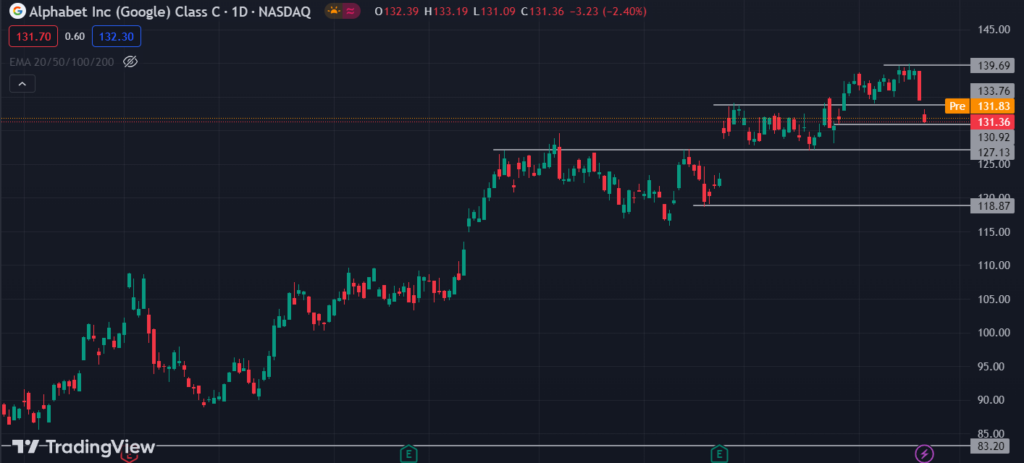
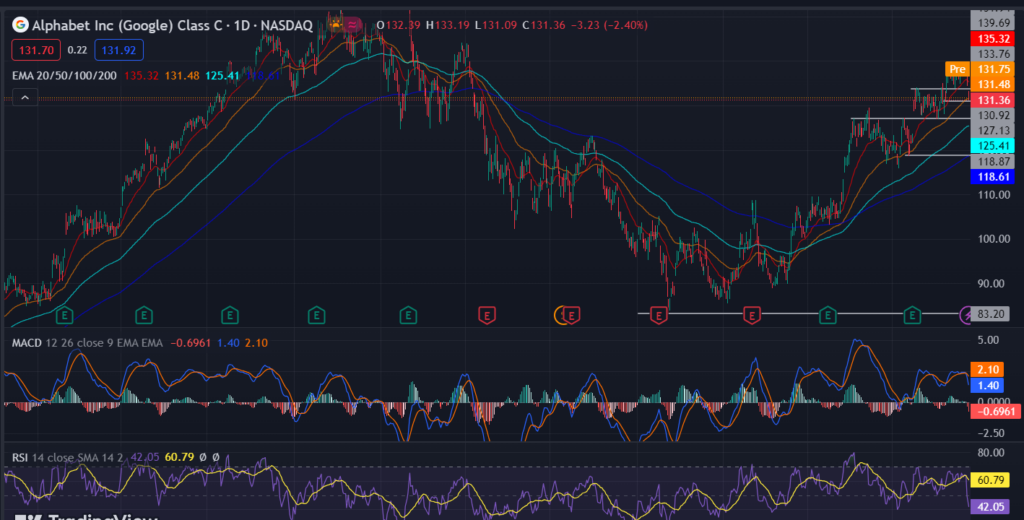
- The Alphabet inc. stock price currently trading at $131.36 between 20 and 50-day and above 100 and 200-day EMAs.
Alphabet Inc. has been trading in an uptrend direction, Since Jan 2023 and recovered almost 57.71%, while the stock price decreased by -2.40% during the intraday trading session. At current the price is trying to make $130.92 its support zone to continue its uptrend journey.
After taking a major support at $83.20 the stock price is set to break the all time high level at $152.10, by continuing its trend till the end of this year, so this stock showing some positive news for bulls, the price is retesting the 50-day EMA to take a U-turn after just crossing down the 20-day EMA.

The stock price is trading in a strong uptrend and shows that the price will more likely to continue this trend after retesting the previous demand zone between the range $130.92 and $127.13, at this current phase the price is dropping down a little bit for a small correction.
After having corrections at demand ranges Alphabet Inc. is set to create a new short term resistance level at $145.06. And again it will retest 40-50% of its bullish impulsive momentum for a short period of time.
Will NASDAQ: GOOG Follow Up Trend Until $151.94 Level?
As per the chart, the stock price is constantly making bullish flag pattern, and breaking out again and again, the forming of flag pattern takes support on 20-day or 50-day EMA, after taking support the price strikes high to break out, this signifies that the trend is respecting both 20 and 50 day EMA.
However, if the price breaks down through both the EMAs 20 and 50-day respectively, it is very much possible that the price will undergo some more deep correction for a short span of time. But there is a higher probability that the price will go upwards.
Alphabet Inc. RetestingThe Demand zone

On April 2023 at level $103.14, the GOOG stock price took support on 20,50,100 and 200-day EMAs, and pulled out the bullish impulsive candle to continue to trade in Up trend direction, after trending bullish the stock price normally retesting the 20- and 50-day EMAs to keep its swing high and higher lows.
The MACD is also showing less volume on the bearish side and high volume on the bullish side both the MACD line and signal are averaging toward bullish volume, indicating that the more quantity is trading in the bullish scenario.
On the other hand, RSI is showing bullish divergence in strength, and the RSI and its signal is averaging to 42.05 and 60.79 range, the signal is closer to upper band and the SMA is closer to lower band.
Technical Levels
- Resistance levels: $139.69 and $151.94
- Support Levels: $130.92 and $127.13
Disclaimer
The views and opinions stated by the author, or any people named in this article, is for informational purposes only. They do not establish financial, investment and any other advice. Investing in or trading stocks comes with the risk of financial loss.
