
- The Axie Infinity coin price can reach $14 in 2023.
- It is currently trading at $4.52 with a repulse of 0.90% in the last 24 hours.
- The token is down by 97.27% from its All-Time High.
Axie Infinity is a game built on the Ethereum blockchain. It is a play-to-earn (P2E) game in the metaverse. The Axie homeland is named Lunacia. It is made up of 90,601 land plots. In the game, players can come together to breed, grow, and battle digital creatures known as Axies.
Axie Infinity marked its all-time high on 07 Nov 2021, when the token was priced at $165.37. The current price of the token is $4.52 with a 30% surge in the daily volume.
- It has a circulating supply of 140,847,526 AXS, which is 52.17% of its total supply.
- The token has a market capitalization of $635 Million.
- The token has a current trading volume of $19.7 Million in the last 24 hours.
In the year 2021, the metaverse sector was growing rapidly, with the ‘big four’ metaverse tokens getting a stumble $16 billion cumulative market cap. However, this excitement seems to have disappeared in 2023, as a keen decline of 92% has been observed across the gaming crypto industry.
The overall market cap of AXS, ENJ, SAND, and MANA tokens has decreased by 92% after marking a high of $16 billion in November 2021. However, this joy seems to have dimmed in 2023.
AXS Token Sentiment Analysis
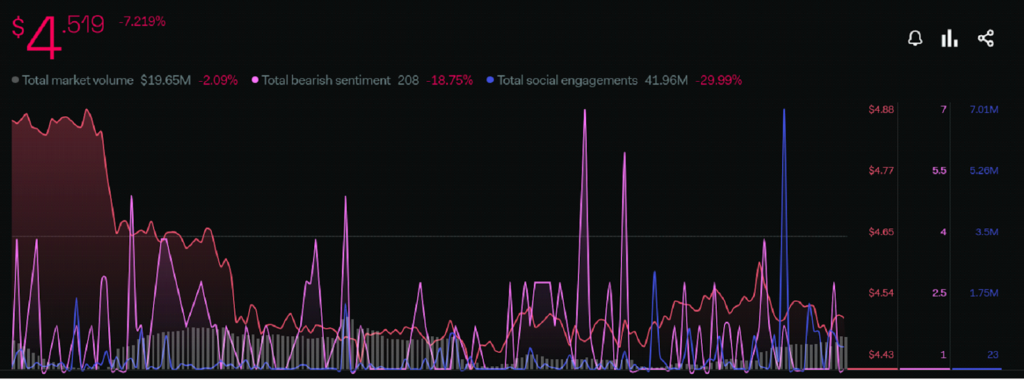
The price of the token has fallen by 7.21% in a week. The total market volume has decreased by 2.09%. The Total social engagements have declined by 29.99% and the total bearish sentiment has decreased by 18.75%.
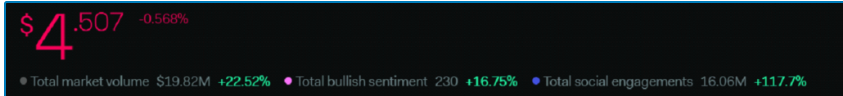
The Daily sentiments are showing a rise in the volume by 22.52% and an increase in the total social engagements by 117.7%. The total bullish sentiments have increased by 16.75%. This token’s overall sentiment analysis shows a positive sentiment in the price of the token.
Weekly Technical Analysis
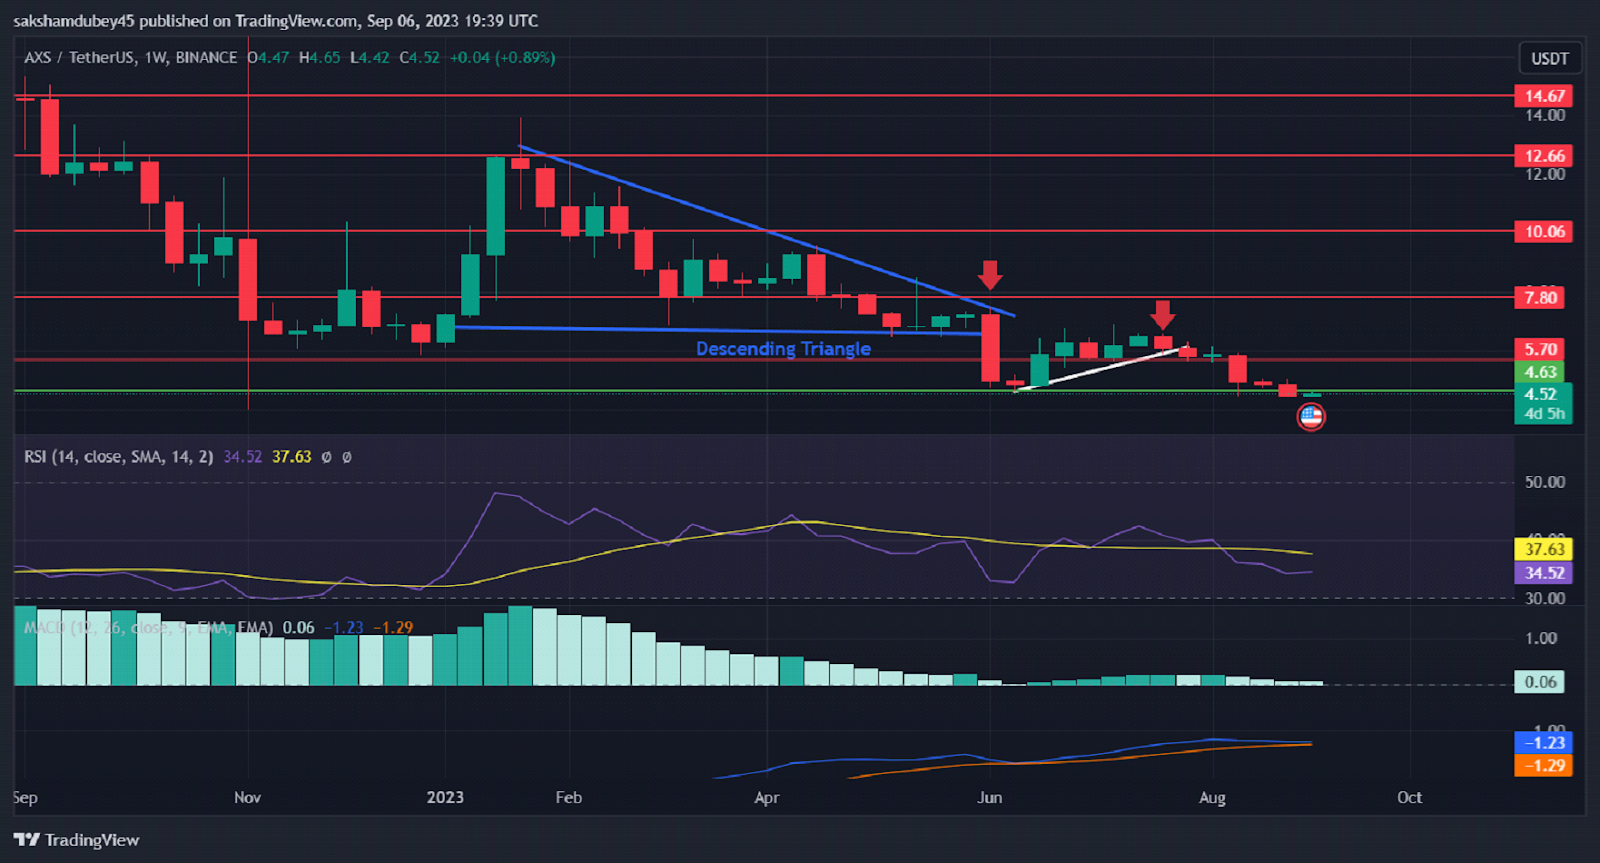
As you can see in the chart, in a weekly timeframe a descending triangle pattern was formed. It gave a breakdown below the pattern and fell and broke the pattern downwards.
After that, the price took support from the support level of $4.6 and started to move in an upward trend by following a trendline. Soon, The trendline broke and the price came down below the support zone of $4.6, and it is now trading at $4.52.
The breakdown below can be a false breakout also as the price in the daily time frame is trying to make a green candle with a substantial inflow of the volume. It also indicates that the bulls are entering the market as the volume is increasing in a daily time frame.
The RSI is below the neutral level of 50. It is currently moving at 34.52 points and SMA 14 at 37.63 points. The RSI also indicates the price is in an oversold region and a bearish trend.
In MACD, Both the MAs are moving pretty close to each other and the fast blue line is trying to cross below the red slow line. The blue line can also bounce from the red line if the trading volume inflow increases in the histogram.
To reach $14 we have to break some major resistance. For that, the bulls have to dominate and keep the price going upward with a good amount of volume to sustain the bullish trend.
Conclusion
The price is currently in a bearish trend. For a successful bounce and reversal, we need to close this week’s candle above the support level. If the candle is made below the support zone, we can see a further fall in the price of the token. We can wait for this week’s candle confirmation for the entries.
Technical Levels:
- SUPPORT: $4.6
- RESISTANCE: $5.7, $7.8 AND $10.06
Disclaimer
The views and opinions stated by the author, or any people named in this article, are for informational purposes only and do not establish financial, investment, or other advice. Investing in or trading crypto assets comes with a risk of financial loss.