
- Dogecoin (DOGE) is currently trading at $0.0682.
- Dogecoin (DOGE)’s live market cap is $9,141,620,594.
- Dogecoin (DOGE)’s price is trading below the 20, 50, and 100-day EMA.
Dogecoin was established in December 2013 by software engineers Billy Markus and Jackson Palmer. It was marketed for the first time as funny, meme-inspired digital money. The “Doge” Shiba Inu meme was used as the insignia.
Dogecoin, like other cryptocurrencies, operates on a decentralized network based on blockchain. It is intended to be a sociable and entertaining cryptocurrency rather than a serious competitor to well-established currencies such as Bitcoin or Ethereum. The vibrant and supportive community known as the “Dogecoin Community” or the “Shibe Army” is one of Dogecoin’s distinctive traits. Members of this community participate in a range of fundraising efforts and charity endeavors.
Trend Analysis
Based on historical data, it is clear that Dogecoin (DOGE) is now experiencing a downward price trend. DOGE’s value has dropped 39.25% in the last seven days, suggesting a poor performance in the market. Looking back two years, DOGE has dropped by 96.08% from its peak price of $0.7003. This negative trend demonstrates DOGE’s problems as well as the coin’s dominant adverse opinion. Furthermore, the observed lack of available coins and resulting low trade volume support the concept of market players’ decreased interest and engagement.
DogeCoin (DOGE) Price Analysis
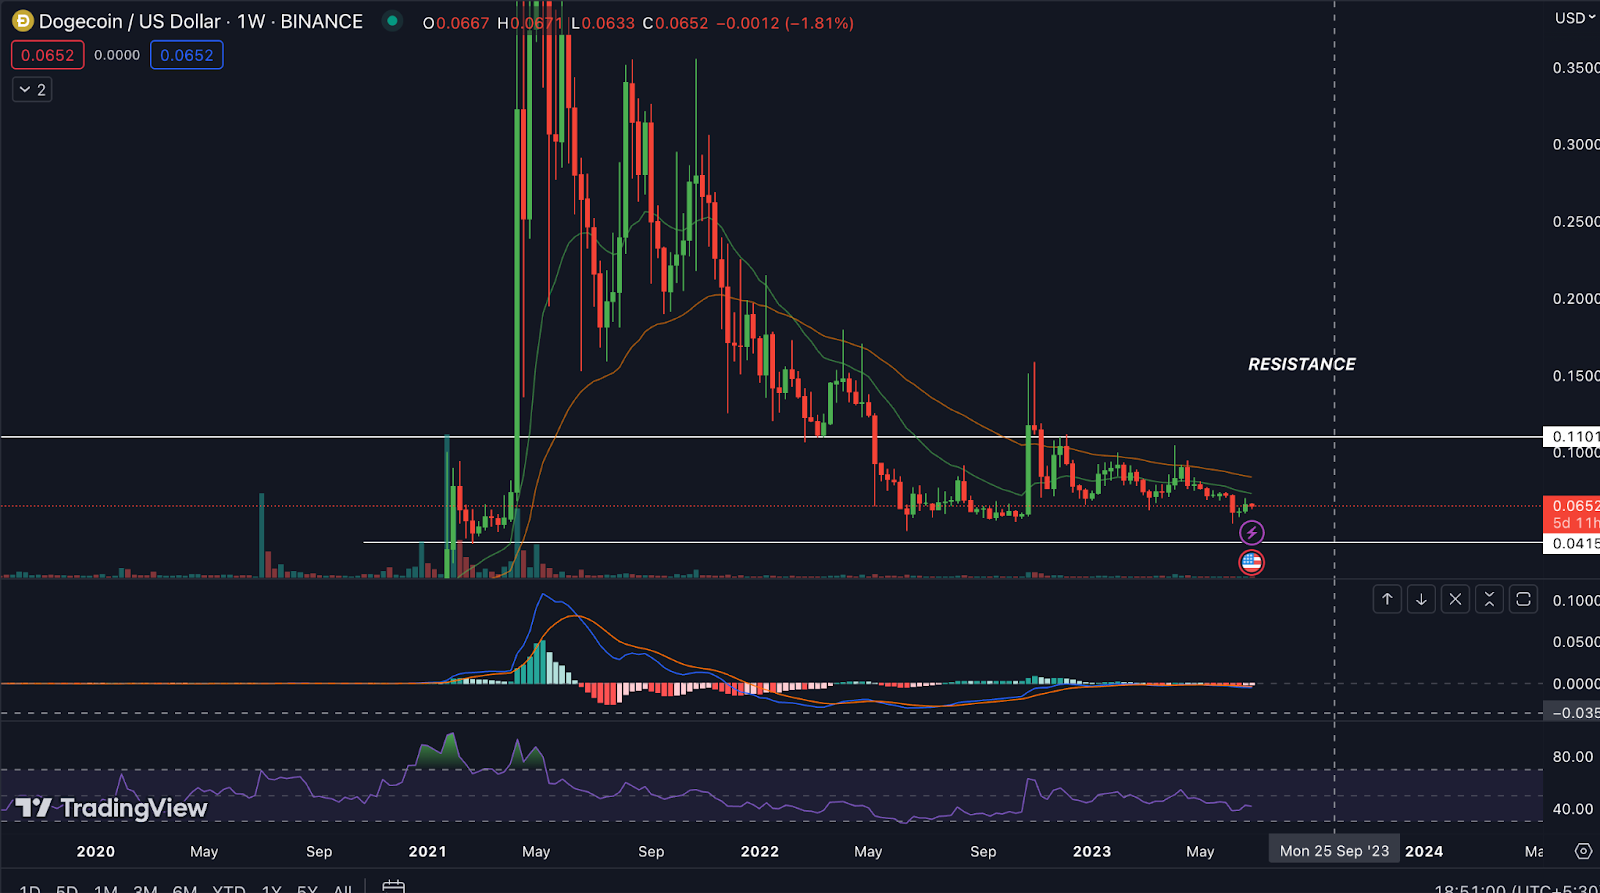
EMA:
On a daily basis, the DOGE price is now trading below the 20-50-day EMA crossover, indicating a bearish trend.
MACD:
Currently, the MACD is going beneath both the 0.0039 MACD signal line and the 0.0041 signal line. Because the MACD and the signal line are both below, the MACD is expected to continue moving in the negative direction.
RSI:
A RSI number of 70 or above indicates an overbought condition, while a value of 30 or lower suggests an oversold position. The 14-SMA line is close to 43.89, and the RSI is now at 40.76, indicating a likely negative drop.
Volume Analysis:
Dogecoin (DOGE) had a 24-hour trading volume of $300,565,398, a rise of -9.70% suggesting a fall in market activity. This indicates that sellers are active and buyers are not taking any interest. Resulting in the decline of the price
Technical Levels:
Support – The current support level of Dogecoin (DOGE) is $0.0415.
Resistance –The current resistance level of Dogecoin (DOGE) is $0.1101.
Conclusion
Based on the examination of the most recent chart, it is clear that the MACD and RSI indicators are both indicating a downward trend for Dogecoin (DOGE). These indications show that the value of DOGE may fall in the future months. As the MACD (Moving Average Convergence Divergence) line is below the signal line, the MACD indicator signals a negative trend. Similarly, the RSI (Relative Strength Index) indicator is trending downward, indicating that DOGE’s momentum is fading. These combined factors point to a bearish prognosis for Dogecoin’s price in the foreseeable future.
Disclaimer
The author’s or anybody identified in this article’s thoughts and opinions are only for informative reasons. They do not provide financial, investment, or any other type of advice. Investing in or trading in cryptocurrency carries the risk of financial loss.