
- AT&T Inc. has reported higher debt as compared to its revenue.
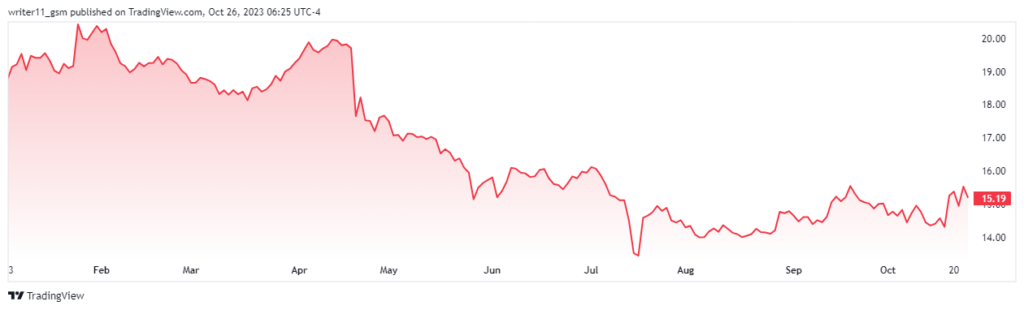
- The T stock has declined by more than 2% in the last trading session and is trading at a CMP of $15.19.
AT&T Inc. is a wireless telecommunications company operating worldwide with more than 160K employees. The current CEO of the company is John T. Stankey and the company was founded in the year 1983.
The debt/equity ratio for AT&T Inc. is 132.14% and the price-to-book value is 0.93. The current ratio of the stock is 0.69 and the gross profit margin ratio of the company is 0.59.
The current market cap of the T stock is $108.593B and the EPS of the company is negative to -1.61 USD. The beta of the T stock is also less than 1 resulting in 0.68. AT&T has 7.143B shares floating in the market.
The company earns its largest chunk of revenue from communication services and more than 95% of the revenue comes from the United States of America. The company has reduced its yielded dividend from the year 2021 to 2022. The total dividend yield for the year 2022 is 6.03%.
Financial Performance For T Stock
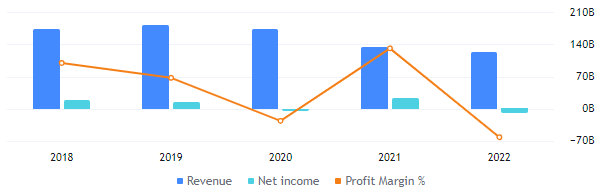
The revenue of AT&T is slowly declining by a few billion every year which is a negative sign for the AT&T company. This has also led to a decline in the profit margin of the company. The net income of the company has declined to -$8.52B resulting in a negative profit margin of -7.06%.
The T Stock is Making a Bullish Pattern On The Charts
The T stock price is consistently declining to lower levels making lower lows. This has led to the formation of the falling wedge pattern and the stock price is still trading inside the wedge pattern. Based upon the very recent price action the T stock is making a bullish pattern on the weekly charts. This behavior can lead to the further advance in the price of the stock.
The EMAs on the weekly charts of the T stock are trading in a death cross. This has led to a strong downtrend in the price of the stock.
The RSI for the stock is neutral to bearish on the weekly charts. The RSI is trying to grab the higher level but is still sustaining below the 50 level. Despite this, the RSI has advanced above the 14-day SMA line.
Conclusion
The financials of the company do not seem reliable due to the advancing debt of the company. Despite this, the technical chart of the T stock is showing signs of bullishness by making bullish candlesticks.
Therefore, if the share price breaks above the level of $16.00, the price may continue to higher levels and hit the upper band of the wedge pattern.
Technical Levels
- Support levels– $9.00 and $13.50
- Resistance levels– $21.50 and $25.50
Disclaimer
The information provided in this article, including the views and opinions expressed by the author or any individuals mentioned, is intended for informational purposes only. It is important to note that the article does not provide financial or investment advice. Investing or trading in cryptocurrency assets carries inherent risks and can result in financial loss.