
- As per Litecoin Price Prediction (BITSTAMP: LTC), the coin price decreased by 1.89% over the last 24 hours.
- The price of the LTC coin is trading at $102.31 and the 52-week price bound range is $46.66 – $114.50.
As per Litecoin Price Prediction, the coin price showed a decline of -6.12% in Open Interest in the last 24 hours. The 24-hour long versus short ratio is 0.8839. The total number of short positions added in the last 24 hours is $417.78K against longs of $2.70 million. In the past 24 hours, the total liquidations coin was at $3.23 million.
This month the coin performed well as it was up by 8.74%. Also, LTC price was up by 38.35% in the last six months which highlighted good performance over a span of six months. Moreover, the Litecoin coin price year-to-date return is positive with an increase of 45.87% and the 1-year performance is positive with a 95.88% rise.
Litecoin Price Technical Analysis in 1-D Timeframe
As per the price action in the long term, it seems the price is taking support on the trendline and also taking support from the various support zone as observed over the daily time frame chart. After every fall, the coin took support and tried to recover from the trendline. However, it is also observed that the coin took rejection from the supply zone and fell 11% now the price is trying to sustain. We can anticipate more upward move only if more volume accumulates.

Source: LTC/USD.1D.BITSTAMP by TradingView
At the time of publishing, the Litecoin coin price (BITSTAMP: LTC) price is trading above the 20, 50, 100, and 200-day EMAs (exponential moving average), which is supporting the coin price trend. There is a possibility that the LTC price will increase even further and More upward movement is expected for the coin in upcoming days.
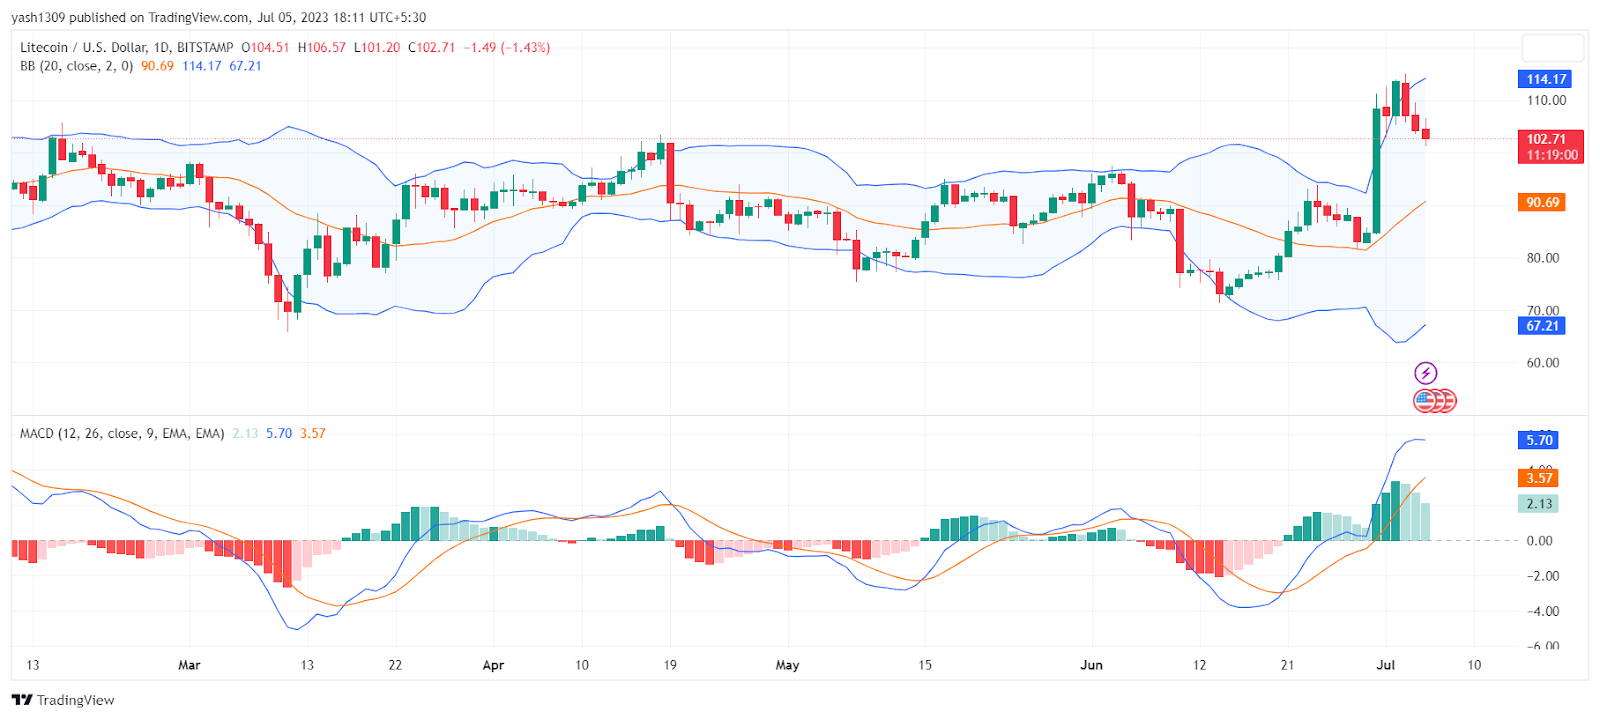
Source: LTC/USD.1D.BITSTAMP by TradingView
The MACD line at 5.71 and the signal line at 3.57 is above the zero line and gave a bullish crossover, suggesting bullish signals. Moreover, the Bollinger band oscillator indicates that the coin is trading at the upper band. Also, the price took support from the 20 SMA line and went upward.
Extraction
The Litecoin price prediction highlights the sentiments and perspectives of investors and traders regarding the LTC coin price being bullish in the 1-D time frame. The LTC price action reflects an optimistic view at the time of publishing. The technical parameters of the LTC price suggest the continuation of the uptrend over the daily time frame chart. The LTC coin price reflects an optimistic view at the moment. Major legitimate indicators MACD, RSI, and EMA, flaunt positive signals about the LTC coin price.
Technical Levels:
- The nearest support: $84.47 and $76.57.
- The nearest resistance: $104.43 and $112.72.
Disclaimer
In this article, the views and opinions stated by the author, or any people named are for informational purposes only, and they don’t establish the investment, financial, or any other advice. Trading or investing in cryptocurrency assets comes with a risk of financial loss.