- Mastercard Incorporated has breached the much-awaited levels.
- Mastercard Incorporated’s price reached an all-time high level of $418.16 on 14 Sept.
- Mastercard Incorporated’s price has declined by 0.17% this week.
The market capital of Mastercard $390.217 billion
The current market price of Mastercard $414.31
The price of the stock was up by $0.97 (0.23%) in the last trading session i.e. on 15 September. The price has declined by 0.17% in a week which shows that the price is facing some pressure currently. Although the price of the stock has surged 5.30% in a month and 28.04% in a year indicates that the price is in a strong uptrend.
The price has breached the crucial resistance level of $396, which the stock has tried to break in the past 2 years. The price is now trading above that resistance level and looking strong at current levels. The stock is facing a slight rejection near the level of $418 over the past few days which indicates the presence of sellers at those levels.
MA company’s revenue has been rising at a good pace over the years as the revenue has surged from $10.78 billion in 2016 to $20.28 billion in 2022. The net income of the company is also following the same path as the net income took a jump of $4.06 billion in 2016 to $9.93 billion in 2022 which is more than double.
Technical analysis of Mastercard Incorporated:
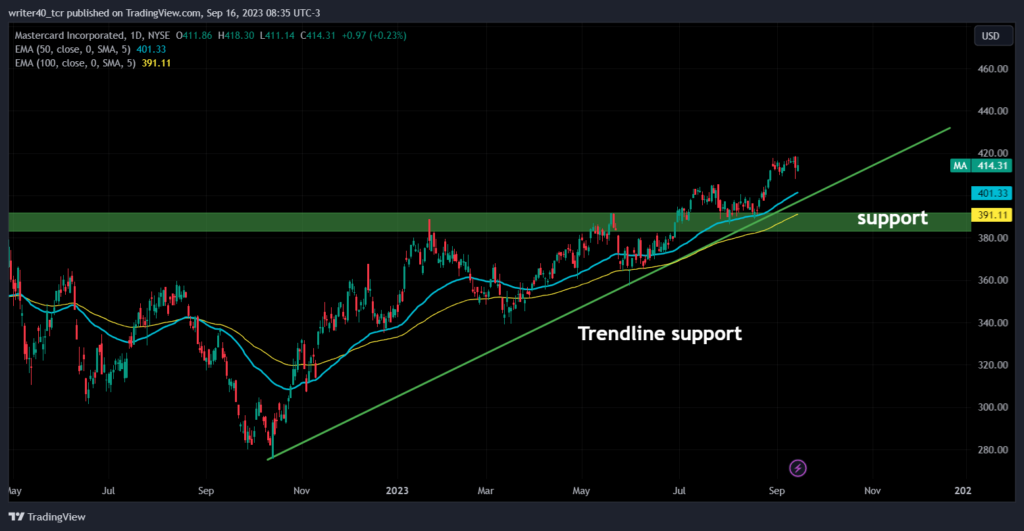
The stock is looking in a strong bullish trend as it recently cleared the major hurdle of $396 (which was the all-time high level till June. The price is trading above both the important EMAs i.e. 50 and 100 and the slope of the EMA is up which shows that the stock is super bullish as of now.
If we talk about the support levels then the stock is currently supported by the rising trendline which is present near the $400 level. And the slope of the trendline is also very strong which means the price can further go up after some consolidation. The crucial support level is between $380-$390 i.e. (the previous resistance level).
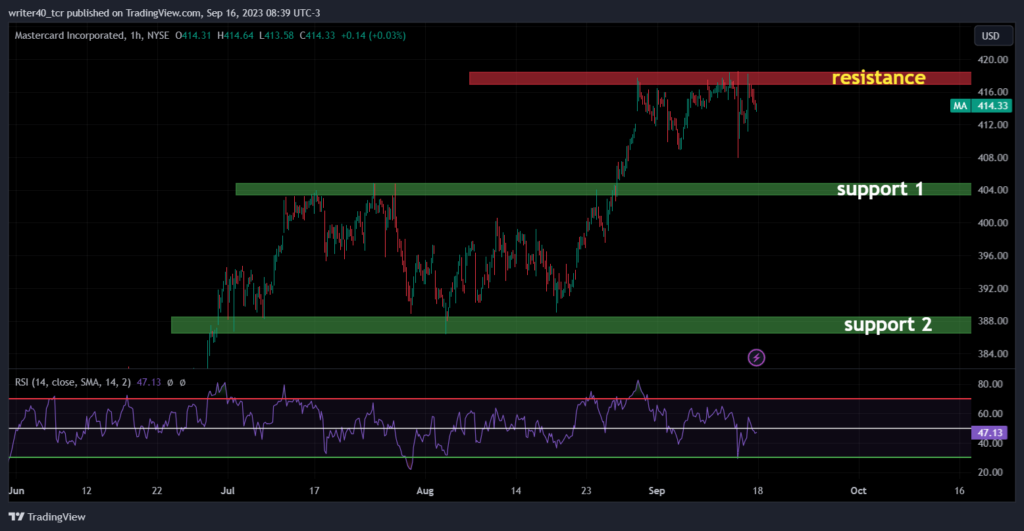
In the hourly time frame, the price has recently created a resistance from where the price is facing a strong rejection. The price is continuously trying to breach that level but it seems that the sellers are more aggressive on that level. The resistance level is currently present near the all-time high of the stock i.e. $418.
If we talk about support then the price can take support near the level of $404, from which the price has been rejected twice. The second support level is near the $388 level, from where the price has taken the support twice. RSI on the hourly chart is still below 50 and it is a good sign as it is very close to 50 and can rise if the price attempts to cross the resistance.
Conclusion:
As the price is taking a rejection and continuously trying to breach that, the resistance will become weak after some time and all the selling will be absorbed by the buyers. Once the price breaks the $418 level it can go more upside as there is no resistance in the past which can restrict the price to go up.
Technical level
Resistance – $418Support – $ 404 – $385
Disclaimer
The analysis is done for providing information through technical analysis and no investment suggestions are given in the article to be made by investors. The coins are unpredictable so investors should have proper knowledge. Cryptocurrencies are highly volatile and risky. Investment should be made with proper technical analysis.