
- Merck & Company, Inc price prediction reveals the bullish strength of the market since September 2022
- MRK stock made a return of 17.28% in one year
- MRK stock made a new all-time high at $119.65.
Merck & Company, Inc price prediction establishes a bullish outlook for the stock which has been growing steadily since September 2022. Since then, the MRK stock has returned a profit of 40% before the recent correction. The Stock made a new all-time high of 119.65 on 3rd May 2022. It was followed by a correction of 8.80% to its current market price.
MRK stock closed its trading session on 7 July 2023 at $109.00. The price dropped 2.46% below its previous day. The overall market cap for Merck & Company, Inc is $276.581 billion.
Can Merck & Company, Inc Continue its Uptrend?
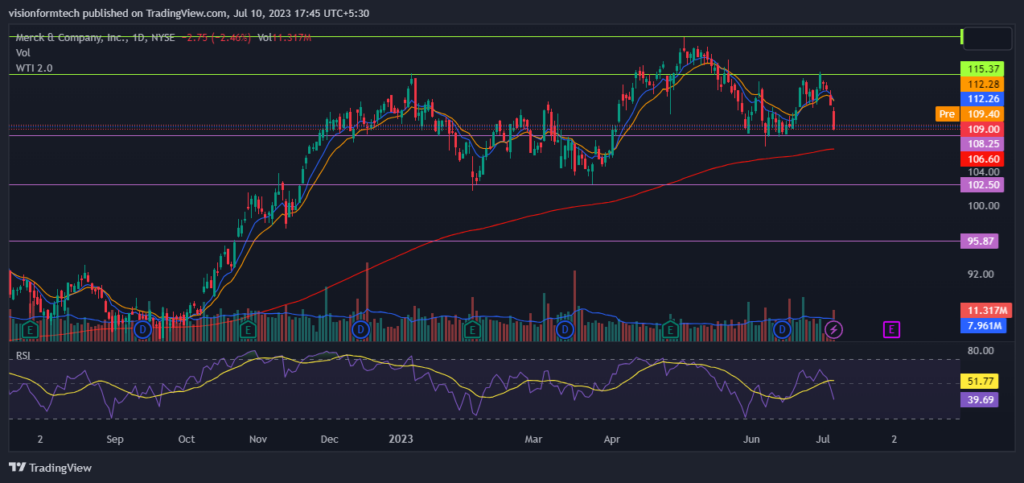
Source: MRK 1D Chart by TradingView
Merck & Company, Inc. price prediction reveals that the price is forming a lower high on the daily timeframe. This breaks the bullish market structure, suggesting that the MRK stock may witness a long correction. The overall trend remains bullish as the price trades above the 200 EMA.
The market is near a crucial support of $108.85. If a family candle closes below this, it will create a lower low which will question the strength of the market. The MRK stock failed to break the resistance of $115.37 which led to a fall of 5% to its current market price. The investors are focused on profit booking which is leading to declining prices.
Will the Market Rebound from Support?
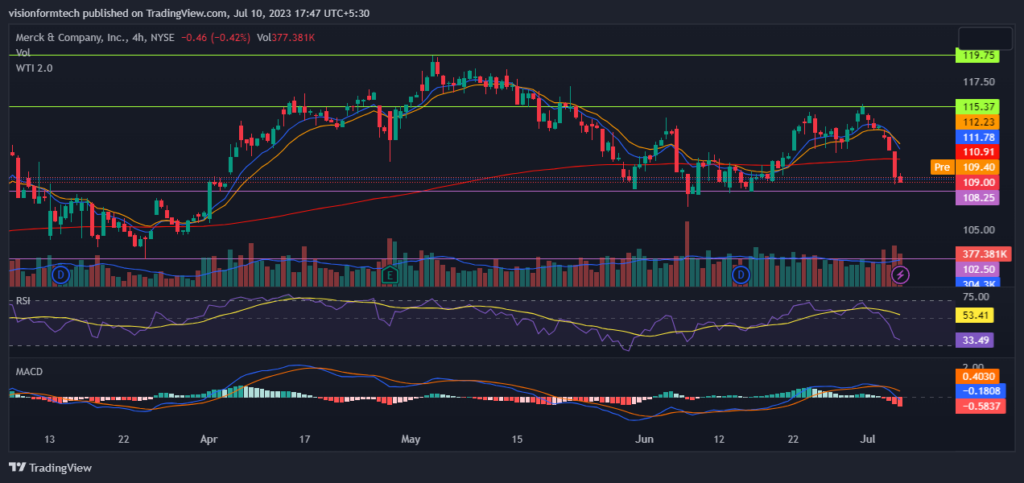
Source: MRK 4-Hour Chart by TradingView
A closer look at the 4-hour chart shows that the price is moving sideways while getting rejected at key resistance. MKR stock moves around the 200 EMA which has gotten flat, which justifies the sideways price action. The volume bars suggest the presence of sellers.
This consolidation phase may have a series of lower highs but it may be possible that the market may develop a bullish pattern such as a bull flag or pull pennant. It is too early to derive such a conclusion yet. However, Breaking the support may result in lower prices in the short term.
RSI: The RSI indicator is currently at 33.49. This represents the weakness of the market where the price is controlled by the sellers. The market may continue to move down until RSI crosses 50.
MACD: MACD made a bearish crossover. The indicator is above the 0 line. The market may get some consolidation or correction, but won’t fall significantly until MACD goes below the 0 line
200 EMA: On the 4-hour chart, the price is trading below the 200 EMA. It indicates that the market is under sell pressure and the bears are in control. The 200 EMA will act as a significant resistance. The price will continue to move down until it breaks above the indicator.
Conclusion:
Merck & Company, Inc price prediction establishes a bullish outlook for the stock which has been growing steadily since September 2022. The market has been in a correction phase for the past few months. The market is changing its mid-term bullish market structure with a lower high. Investors are advised to watch for support levels as a reversal from there may bring back the bullish momentum. The volatility can be fruitful for investors with excellent risk management skills.
Technical Levels
- The nearest support: $108.25
- The nearest resistance: $115.37
Disclaimer:
The views and opinions stated by the author, or any people named in this article, are for informational purposes only and do not establish financial, investment, or other advice. Investing in or trading crypto assets comes with a risk of financial loss.