
- Polkadot price prediction indicates that the DOT crypto has made a decent recovery from its swing low
- DOT price reported a year-to-date profit of 27.53
- Polkadot price is attempting to form a double bottom pattern with a price target of $11.7.
Polkadot’s (DOT) price prediction unveils the recovery phase of the DOT crypto, which fell from its resistance of $7.5. The DOT crypto began the year 2023 with a bullish push on the market. The price surged 80% from its swing low to the resistance level of $7.50. However, the bulls had to surrender to the bears, who became responsible for the fall of 47% to the critical support price of $4.267. Since then the market has been trying to recover by taking a bounce from the support.
At the time of writing, the current market price of DOT tokens is $5.49. The 24-hour trading volume surged 97.75%. The market is up 5.60% in the last 24 hours. The overall market cap of Polkadot is $6,622,710,896.
Can DOT Complete the double bottom pattern?
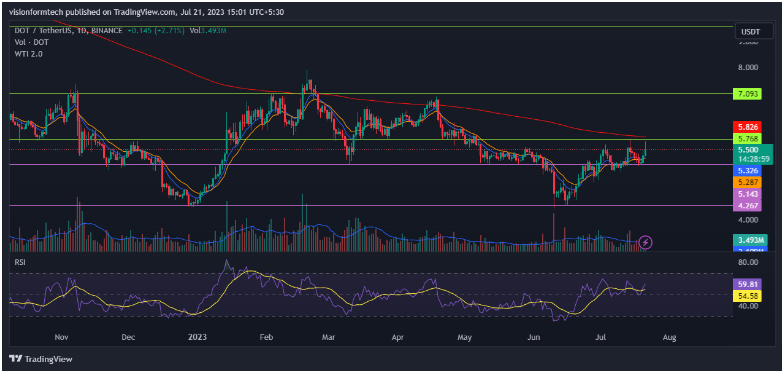
Polkadot’s (DOT) price indicates that the DOT crypto price has made a recovery of 38.08% from the support level of $4.267. With this bounce, the bulls managed to invade the resistance of $5.143. As of now, the price is battling to break the next barrier of $5.768, which aligns with the 200 EMA.
As the market rises from the support, the price action potentially forms a double-bottom structure. If the DOT token reaches the resistance of $7.20, it will complete the double pattern, with a potential target of $11.70. A sustained breakout may propel the price by 65%, marking a new high since 2022.
Will Polkadot (DOT) Break Past the resistance to the upside?
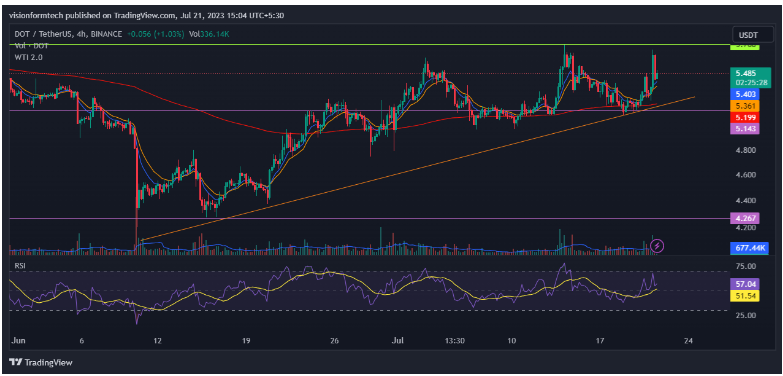
On the 4-hour chart, the DOT price is bullish in the short term as it creates a bullish market structure. The price has also crossed the 200 EMA while taking the support of the 9 and 15 EMAs. This is a bullish sign in the short term. As the price approaches the resistance of $5.768, the bulls get eager to breach this level.
However, the price moves up while taking support from an ascending trendline. Such a market structure may have a bearish outlook if the price breaks the trendline. If it happens, the DOT token price may slide 18% to the support of $4.267. On the flip side, the break of the resistance may escalate the price to its next hurdle at $7.00
RSI: The RSI indicator is currently at 57.59. It represents bullish conditions where the price may continue to rise until RSI crosses below 50. Aggressive buying may happen only if RSI goes above 70.
MACD: MACD made a bullish crossover below the 0 line. This indicates that the market may move to the upside in the short term. The price can rise until the MACD makes a bearish crossover.
200 EMA: On the 4-hour chart, the price is above the 200 EMA. This means that the market is bullish with the control of the buyers. The 200 EMA acts as a dynamic support and the price may move up until it crosses below the 200 EMA.
Conclusion:
Polkadot’s (DOT) price prediction unveils the recovery phase of the DOT crypto, which fell from its resistance of $7.5. The market has been recovering over the past few days. The momentum has faded as the price reaches resistance. It’s best to wait for the price to break the resistance and sustain above it. It is important to stay cautious and maintain risk management rules.
Technical Levels
- Support level: $5.142
- Resistance level: $5.768
Disclaimer:
The views and opinions stated by the author, or any people named in this article, are for informational purposes only and do not establish financial, investment, or other advice. Investing in or trading crypto assets comes with a risk of financial loss.