
- PRICE IS CONSOLIDATING IN A RANGE FOR MORE THAN A YEAR.
- RKT IS DOWN BY -15 % FROM ITS 52 WEEK HIGH PRICE AND UP BY MORE THAN 25 % FROM ITS 52 WEEK LOW PRICE.
- RKT REVENUE DOWN BY 61.51% AND NET INCOME DECLINE BY 84.94 %.
MARKET CAPITAL OF ROCKET COMPANIES (RKT) – $ 20.306 B
CURRENT MARKET PRICE OF ROCKET COMPANIES (RKT) – $ 10.27
The stock is down by over 73% off its high( i.e 38.25 ) made on 2nd march 2021 as the profit is declined by 84.94% and and revenue declined by over 61.51 % which is not a good sign for any company as it generated a significant result in 2 consecutive years i.e 2020 and 2021 where the revenue jumped by over 200 % .
After 2021 both EPS and net income declined by over 82% which created a panic in the stock and stock fell down about 70 % within a year. Since then the company’s financials are performing poorly, creating some more pressure on the stock .
Although the future estimation of the company is on a positive site as per the experts, and the result of which the company even after generating losses the sell off is halted as of now.
Apart from the poor financials, one thing which is providing some sigh of relief for the investors and promoter is the declining net debt of the company. Debt which was over $25.41 B in 2020 is now standing at $9.56 B and the experts are expecting a rise in EPS from -0.8 to 0.49 .

RKT stock price is forming a base as the stock price is sideways to upward in this range along with it the price gave a breakout of a symmetrical triangle pattern but failed to gain the necessary momentum and is now consolidating above that. The supply zone is spotted near $15.61 and $16.15and 52 week low level i.e $ 6 will act as a demand zone for the price as of now, and if we talk about RSI it is trading below 50 which is not a good sign.
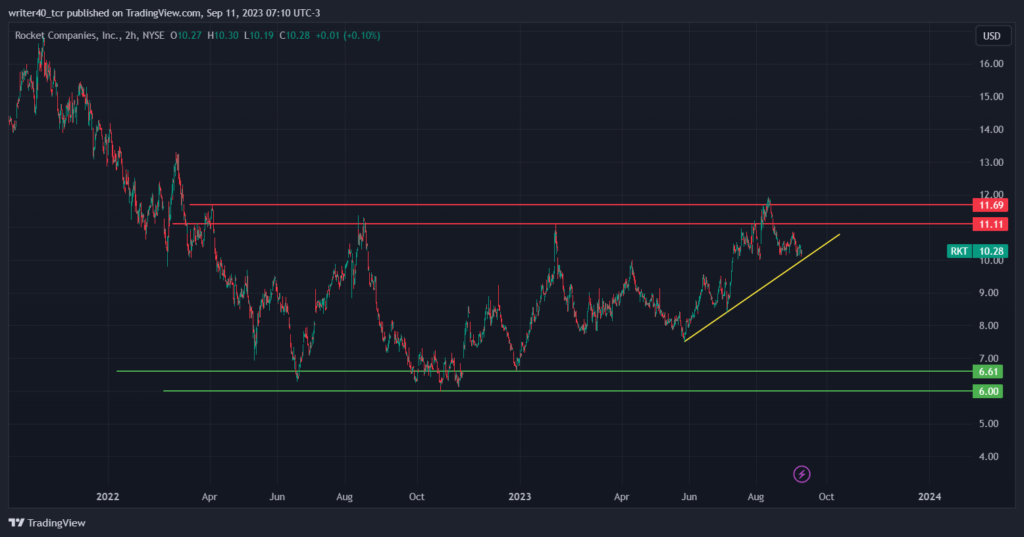
On 2 hour time frame the stock is looking sideways as it is trading in a broader range of $ 7 – $ 12 and where the stock is currently trading at higher levels of this range supported by the upward sloping trendline which is acting as a support for the price.
There are some big volume bars visible at higher levels indicating that the profit booking has done at those levels and which is a sign that the stock can further continue this consolidation phase .
CONCLUSION :-
Although the price tried to escape the range but it gave a fake breakout and came back to the consolidation zone and now training near to the trendline , which is a very crucial support level for the price, and if the trendline pushes the price upward then the recent highs will act as a resistance level for the stock.
Technical levels:-
Resistance – $ 11.2 – $ 12
Support – $ 6.6 – $ 6
DISCLAIMER-
The views and opinions stated by the author, or any people named in this article, are for informational purposes only and do not establish financial, investment, or other advice. Investing in or trading crypto assets comes with a risk of financial loss.