
- Unilever has been trading in a 200 pound range since almost 10 months now.
- The stock broke this zone in April but only for a month when it collapsed to new lows
- The stock is giving mixed signals currently which can be a problem for the investors.
Unilever is a globally known brand which offers products in more than 10 segments including desserts, beauty, healthcare, medicine etc. Founded in 1929, the company operates in more than 1900 countries and employs over 150000 people globally. The company is long known to the public and thus is highly trusted both in its products and in its stocks as well. The company has various subsidies in different countries to conduct its operations and those subsidies are listen in the respected countire’s exchanges as well.
Technical analysis for the stock-
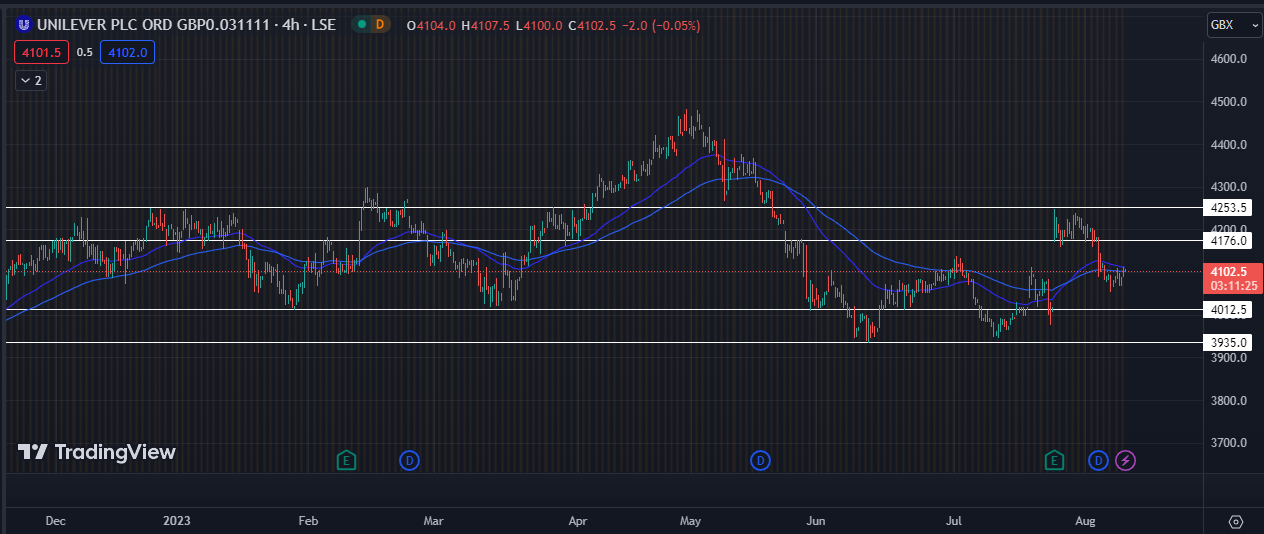
The stock has been stuck in a zone between 4000 and 4200 pounds and has constantly traded in this. We saw a big breakout in april which was followed by an even shaper selling that led the stock touching new lows at 3930 pounds.
The stock currently looks stable but major indicators on a daily chart signal towards a potential downside in the stock. If this really happens, we might see 4012 levels which are a strong support for the stock historically.
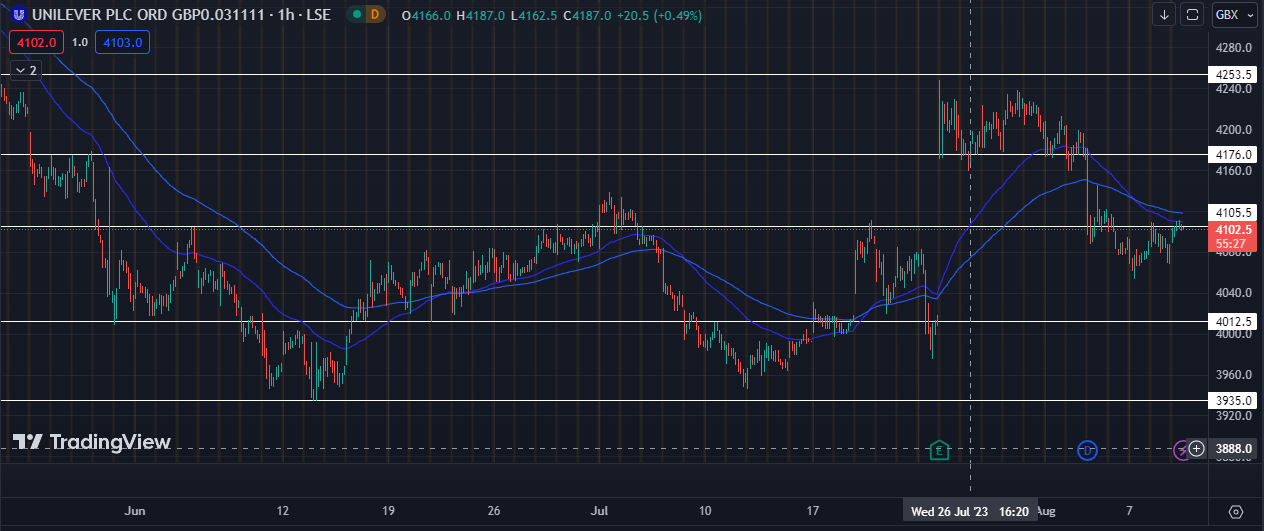
A 1 hour chart shows the stock taking rejection from its current resistance at 4105 but is trading very near to this levels so we might see this levels to act as a support in the upcoming weeks.
If the stock does slump down from this zone, we have a long target till 4015 pounds. Indicators currently show the stock to be in a neutral state for a smaller time frame and therefore until and unless there is a confirmation, one must not enter the stock.
The stock has seen sharp selling from the past 20 days and until and unless we see buyers entering with a huge volume, we should expect a potential downside in the stock.
Conclusion:
The stock currently looks negative but chances of a huge downside are less.
4140 currently acts as the next soft resistance incase the stock shoots up and can also be considered a good accumulation level for people looking to enter long.
The stock might go down till 4080 levels but further downside from these levels are not expected until and unless there is some negative news or trend in the overall market.
Major technical levels for the stock-
Major support levels- 4080 followed by 4010 pounds.
Major resistance levels- 4140 followed by 4180 pounds.