- SSE(Scottish and Southern Energy) is a multinational energy resource company.
- SSE was founded in 1998. The chairman of the company is Richard Gillingwater. The stock of the company is listed on London Stock Company(LSE).
- In this article we will analyse the stock price of SSE.
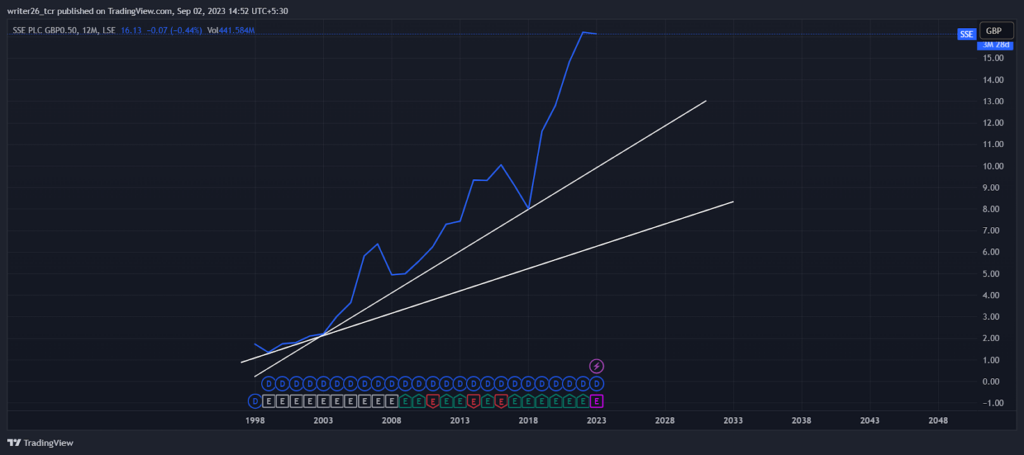
SSE stock overall is in uptrend by 390.88% from the beginning till date. The stock is great for long term investment. The stock is up by 28.94% in the past 5 years.
However, the stock was down by (4.07%) last year. But overall it is in uptrend. The retracement or fall are the corrections made by the market forces.
Moreover, the stock is down by (1.52%) last month and up by 0.40% weekly. We will analyse the stock through technical analysis.
Technical Analysis of SSE(Yearly)
In the yearly time frame the stock is in uptrend. It is up by 390 times from the price at which it got listed. The stock is very much suitable for long term investment. As we can see in the image the stock just made its all time high. The chances of high return are possible as the stock is in continuous uptrend.
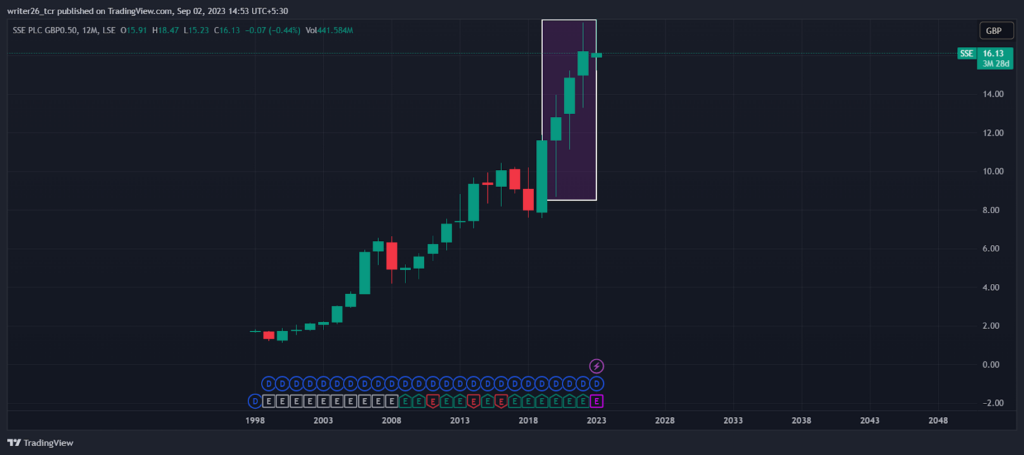
The pattern in the rectangle represents three white soldiers indicating that the stock will continue its uptrend and the result is also the same. The next green candle is indicating that the stock is continuing its trend.
Investors should invest their money in the trending companies to generate a good amount of returns on their investment. The stock is great for long term investment.
Technical Analysis of SSE(Monthly)
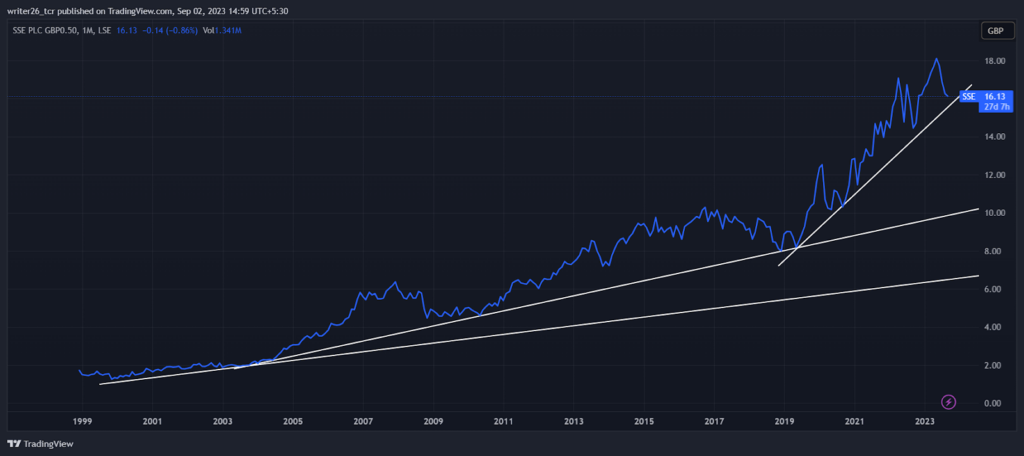
In the monthly time frame the stock is in uptrend and at the current market price there is an opportunity to enter in the market as the stock may take support from the uptrend line and may continue its up movement.
The stock is down by (6.51%) in the last 6 months. The correction or the retracement is necessary for every stock and this stock is also retracing in the last 6 months but it will bounce back by taking support from the trend line.
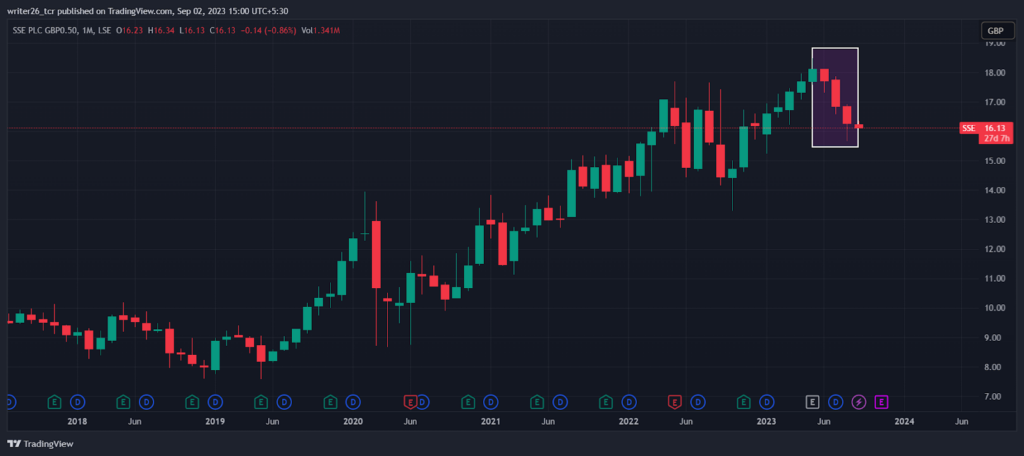
As we can see the three black crows pattern it indicates that the stock may retrace to the support point on the trend line and from there it can show some up movement as the stock overall in uptrend.
Technical Analysis of SSE(Weekly)
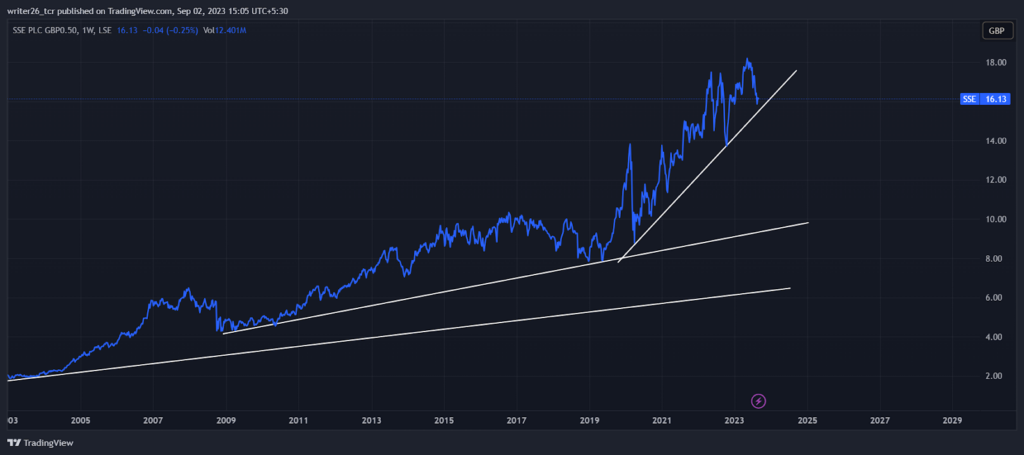
The stock overall is in uptrend but near current market price it is in downtrend. So for swing traders this stock is suitable as the stock is up by 0.40% and overall the stock is in uptrend. The stock is suitable or good for long term, medium term and short term investment.
The stock may take support and continue its up movement in the future. For investment purposes this type of stock is very good as it will give a very good return on the investment.
Technical Analysis of SSE(Daily)
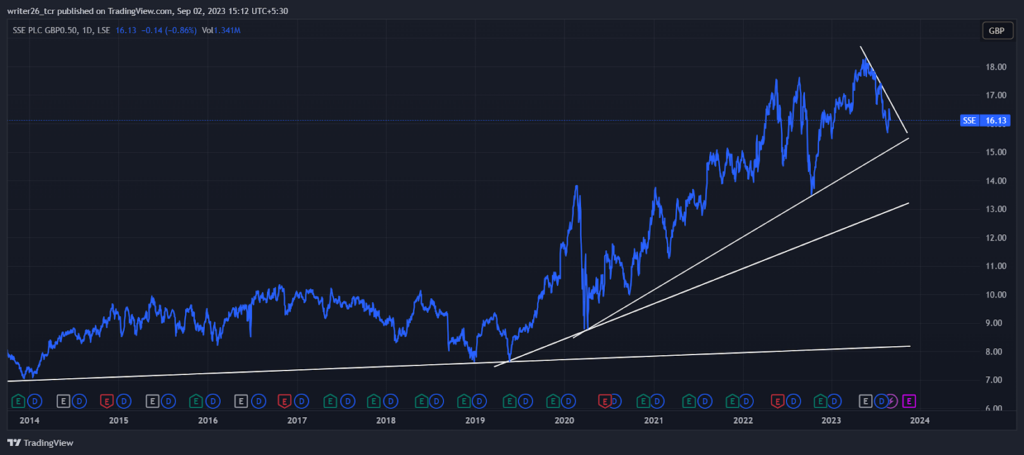
The stock overall is in uptrend but it is retracing near the current market price and may take support from the trend line and again starts its up movement because overall it is in uptrend.
There is an opportunity for investors to invest in the stock at GBP- 15 price. The stock overall is good for investment in any time frames i.e., yearly,monthly,weekly or daily time frame.
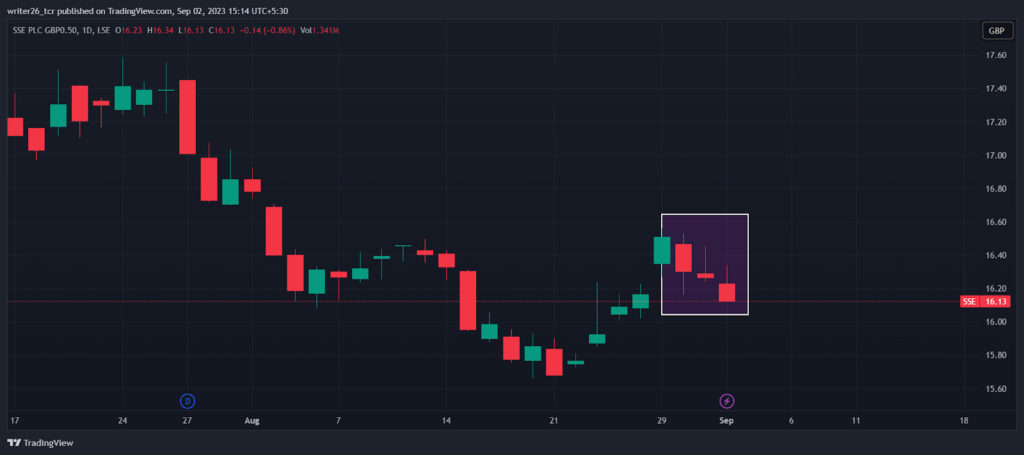
The pattern clearly confirms that the stock will retrace to the trend line due to the formation of three black crows.
The stock is down by (0.71%) in the daily time frame but as the stock overall is in upward direction the fall is retracement process or corrections made by the market forces.
Levels
Resistance Level- GBP-17.42 and GBP- 17.87
Support Level- GBP-16.49 and GBP- 15.98
Summary
SSE stock overall is uptrend and a good watch for investment in the future. The stock is performing extremely well and constantly in uptrend. In all time frames the stock is in uptrend.
Disclaimer
The analysis is done for providing information through technical analysis and no investment suggestions are given in the article to be made by investors.

